
On the back of a strong US dollar, the pound is expected to close the week below 1.3100.
- The GBP/USD is gaining up some 0.18% in the week amidst a thin liquidity trading session.
- A buoyant US dollar and risk-aversion weighed on the British pound in the week.
- GBP/USD Price Forecast: To remain downward biased but a double bottom looms.
The pound remained on the defensive, trading below the 1.3100 level on the back of a strengthening US dollar, despite a lackluster trading day due to the closure of financial markets in the UK. As part of the celebration of Easter Friday. At the time of writing, the pound/dollar exchange rate is trading at 1.3061.
The pound-to-dollar exchange rate has been under pressure throughout the week. As a result of the higher US dollar and reduced risk appetite, the GBP bulls have been scared, and the GBP/USD is poised to close the week with tiny gains of 0.18 percent. On the other hand, the US Dollar Index, which measures the value of the dollar relative to a basket of foreign currencies, is up 0.68 percent this week, standing at 100.519, supported by high US Treasury rates throughout the week.
Despite conflicting economic data from the United Kingdom this week, the pound/dollar traded in a range of 1.3000-1.3160. Inflation in the United Kingdom increased beyond the 7 percent threshold, above the 6.7 percent prediction, paving the way for a following 25 basis point rate rise by the Bank of England. Meanwhile, the Gross Domestic Product (GDP) for February was disappointing, increasing by 0.1 percent month on month, lower than the 0.3 percent forecast, sending a warning that the UK's economy is stalling, as reported by the Financial Times. When it comes to labor statistics, the results were mixed. The Employment Change for January was disappointing, with only 10K new positions added compared to the anticipated 50K, but the Unemployment Rate for February came in at 3.8 percent, which was in line with expectations.
Consumer inflation in March exceeded the 8 percent threshold, rising to 8.5 percent year on year, the highest level since 1981, while inflation excluding volatile items, the so-called core, increased 6.5 percent year on year, lower than the forecasted 6.7 percent, a sign that inflation was about to reach a nadir. Nonetheless, the Producer Price Index (PPI) released on Thursday exceeded estimates by a wide margin, revealing that prices paid by producers increased by 11.2 percent, compared to predictions of a 10.6 percent increase. Core PPI, on the other hand, climbed by 9.2 percent, a greater rate than the previous year's 8.4 percent. Tier 2 data will be featured on the economic calendar in the next week, according to the forecast. Retail Sales in the United Kingdom are likely to have contracted by 0.3 percent in March, according to forecasts. On the domestic front, the Federal Reserve Beige Book and the S&P Global Manufacturing and Services PMIs will be unveiled on the docket.
GBP/USD Price Forecast: Technical outlook
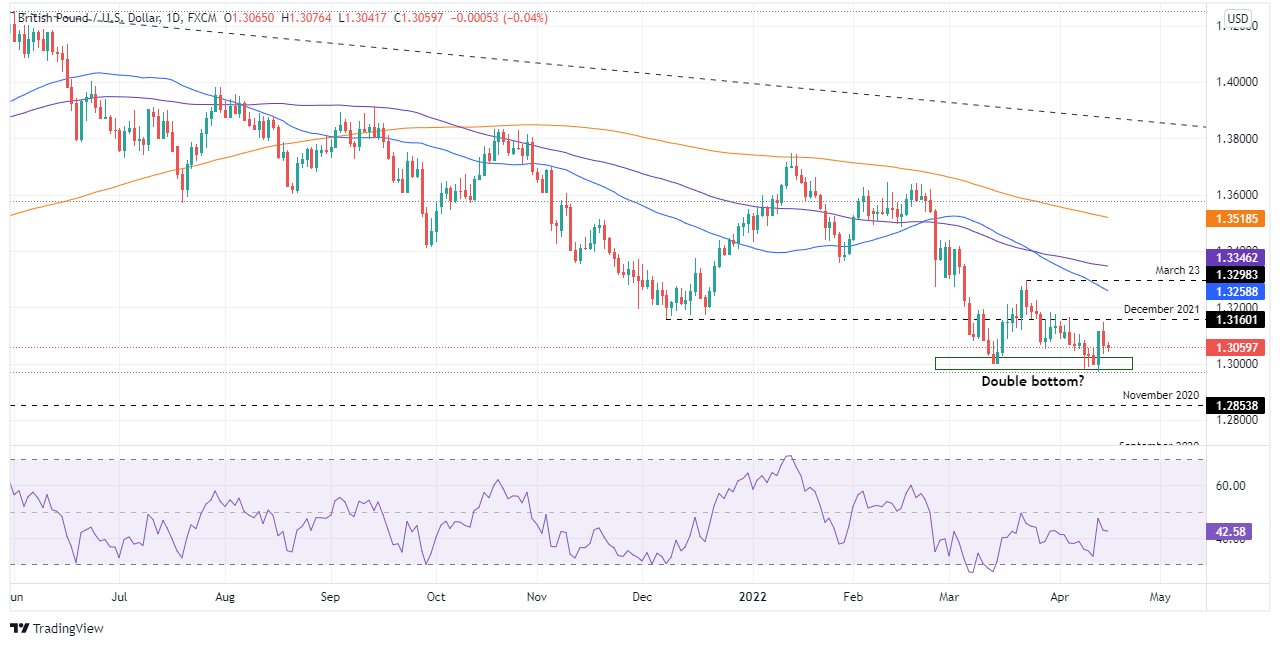
The GBP/USD is forming a double bottom in the vicinity of the 1.3000 level, but the daily moving averages (DMAs) placed above the present price indicate that the pair is inclining lower. In accordance with the aforementioned is the Relative Strength Index (RSI) at 42.60, however it is worth noting that the oscillator has a horizontal slope, which indicates that the pair may stabilize around the 1.3050s level before continuing its downward trend.
The initial level of support for the GBP/USD would be 1.3000. Once crossed, the next level of support would be 1.2900, followed by the cycle low of November 2020 at 1.2853.
GBP/USD must rise to at least 1.3299, the March 23 swing high, in order to be considered a confirmation of the double bottom scenario. Once this is completed, the first point of resistance for the GBP/USD would be the 100-day moving average (DMA) at 1.3358, followed by 1.3400, and finally the 200-day moving average (DMA) at 1.3518.
GBP/USD
| OVERVIEW | |
|---|---|
| Today last price | 1.3061 |
| Today Daily Change | -0.0007 |
| Today Daily Change % | -0.05 |
| Today daily open | 1.3072 |
| TRENDS | |
|---|---|
| Daily SMA20 | 1.3116 |
| Daily SMA50 | 1.3271 |
| Daily SMA100 | 1.3352 |
| Daily SMA200 | 1.3526 |
| LEVELS | |
|---|---|
| Previous Daily High | 1.3147 |
| Previous Daily Low | 1.3034 |
| Previous Weekly High | 1.3167 |
| Previous Weekly Low | 1.2982 |
| Previous Monthly High | 1.3438 |
| Previous Monthly Low | 1.3 |
| Daily Fibonacci 38.2% | 1.3077 |
| Daily Fibonacci 61.8% | 1.3104 |
| Daily Pivot Point S1 | 1.3021 |
| Daily Pivot Point S2 | 1.2971 |
| Daily Pivot Point S3 | 1.2908 |
| Daily Pivot Point R1 | 1.3135 |
| Daily Pivot Point R2 | 1.3198 |
| Daily Pivot Point R3 | 1.3248 |


.jfif "US Dollar Index advances to new cycle tops near 100.50")


